Interactive Statistics
Tools That Explain.

Explore probability distributions, compare models, fit sample data, and calculate statistical tests in one free browser workspace.
See the formula, visualization, assumptions, and interpretation together.

Launch Workspace
Simple Workflow

From Data to Discovery

Step 01

Enter or Sample Data

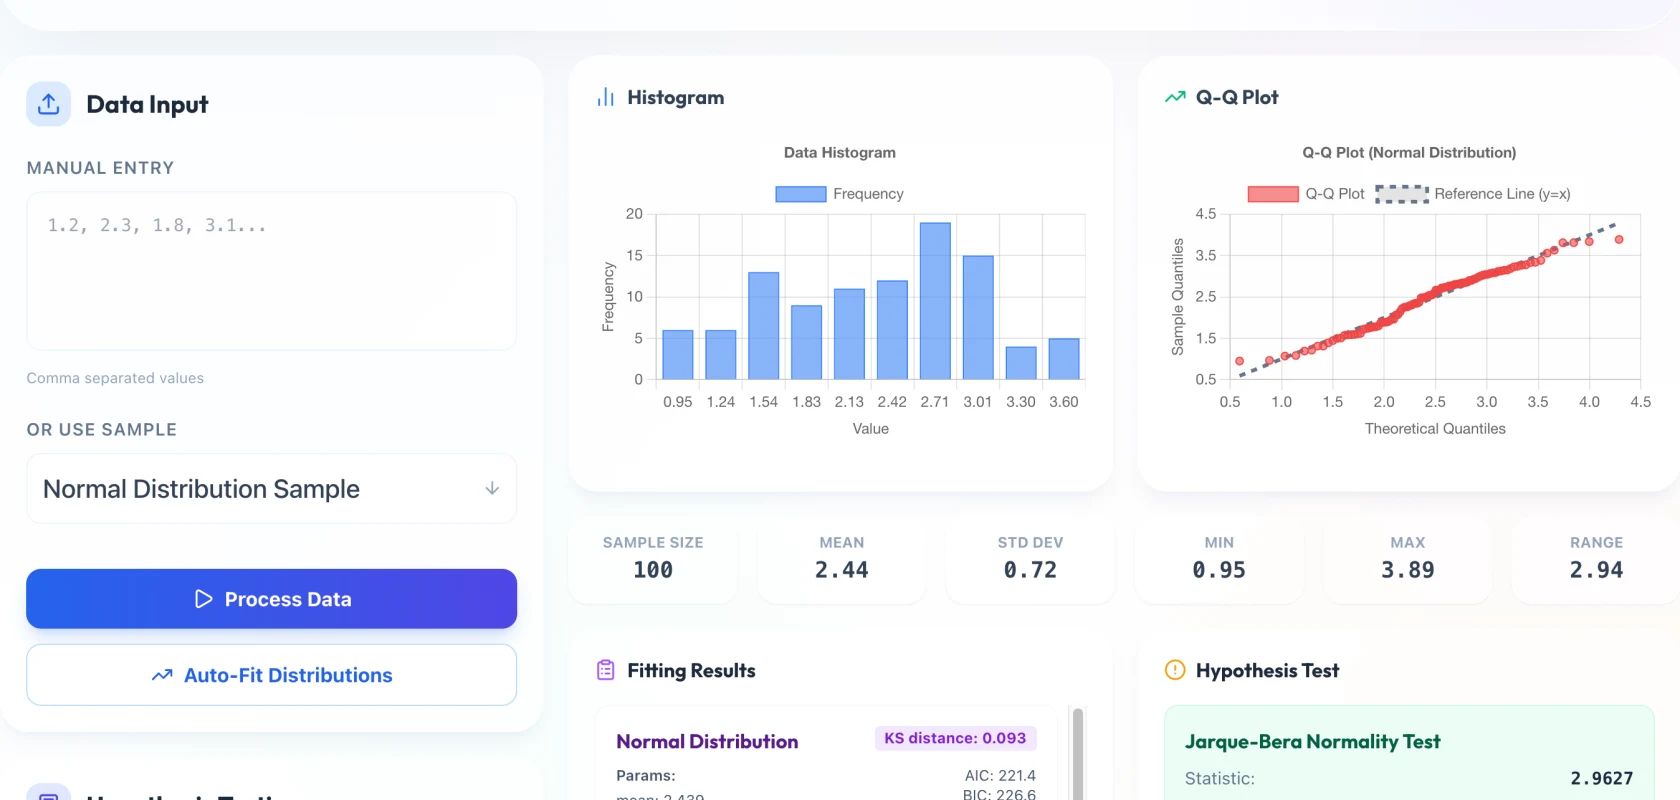
Paste comma- or space-separated observations, or begin with one of the built-in sample datasets.

Step 02

Fit and Test

Run automatic distribution fitting and hypothesis tests to evaluate how well the data matches your assumptions.

Step 03

Review Diagnostics

Inspect histograms, Q-Q plots, and goodness-of-fit metrics to support your statistical conclusions.

Built for Deep Understanding

DistriScope bridges the gap between theoretical statistics and practical application, providing a unified platform for teaching, learning, and research.

For Educators

Teaching Reimagined

Transform abstract statistical theories into tangible, interactive experiences. Engage students with dynamic visualizations that demonstrate concepts in real-time.

For Students

Mastery Through Practice

Move beyond static textbook examples. Experiment with parameters, observe immediate effects, and build intuitive understanding through hands-on exploration.

For Researchers

Rigorous Analysis

Compare theoretical models against observed data, inspect fit diagnostics, and validate assumptions with interactive statistical tests.

Free online statistics workspace

Understand the model, not just the answer

DistriScope is an interactive statistics learning and analysis platform. It combines probability distribution visualizers, model comparison, convergence demonstrations, data fitting, and hypothesis-test calculations in a browser-based workspace. Each tool is designed to connect numerical output with assumptions, formulas, graphics, and plain-language interpretation.

Use it to test an intuition before writing code, check a classroom calculation, compare candidate distributions, or explain why a statistical result changes. Statistical inputs for the core tools are processed in the browser. For consequential decisions, preserve your inputs and verify the result with independent software and qualified review.

DistriScope statistics workspace showing an interactive probability distribution
Statistics tools available in DistriScope
GoalMethodsGuide
ExploreContinuous and discrete probability distributionsRead guide
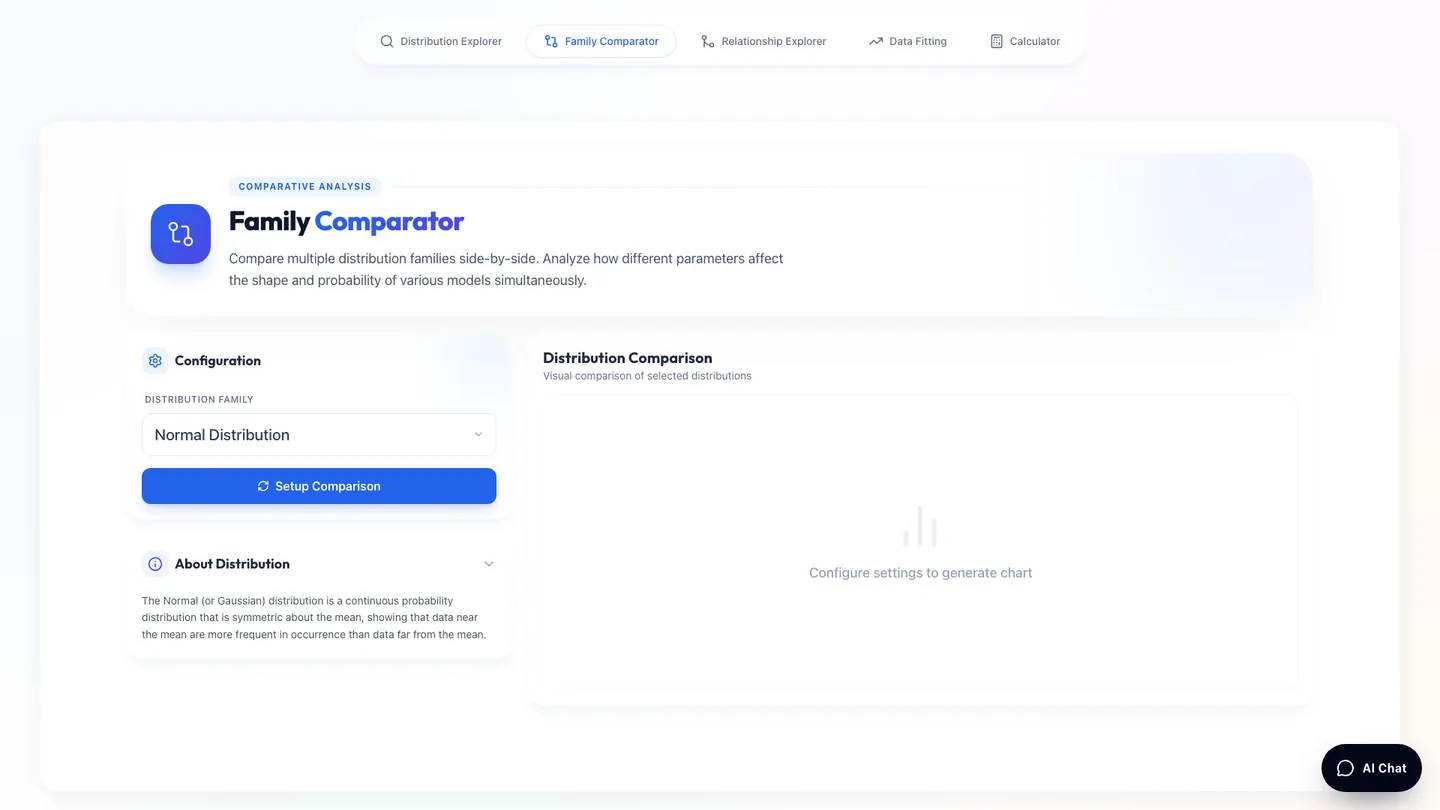
CompareDistribution families, shape, support, and tailsRead guide
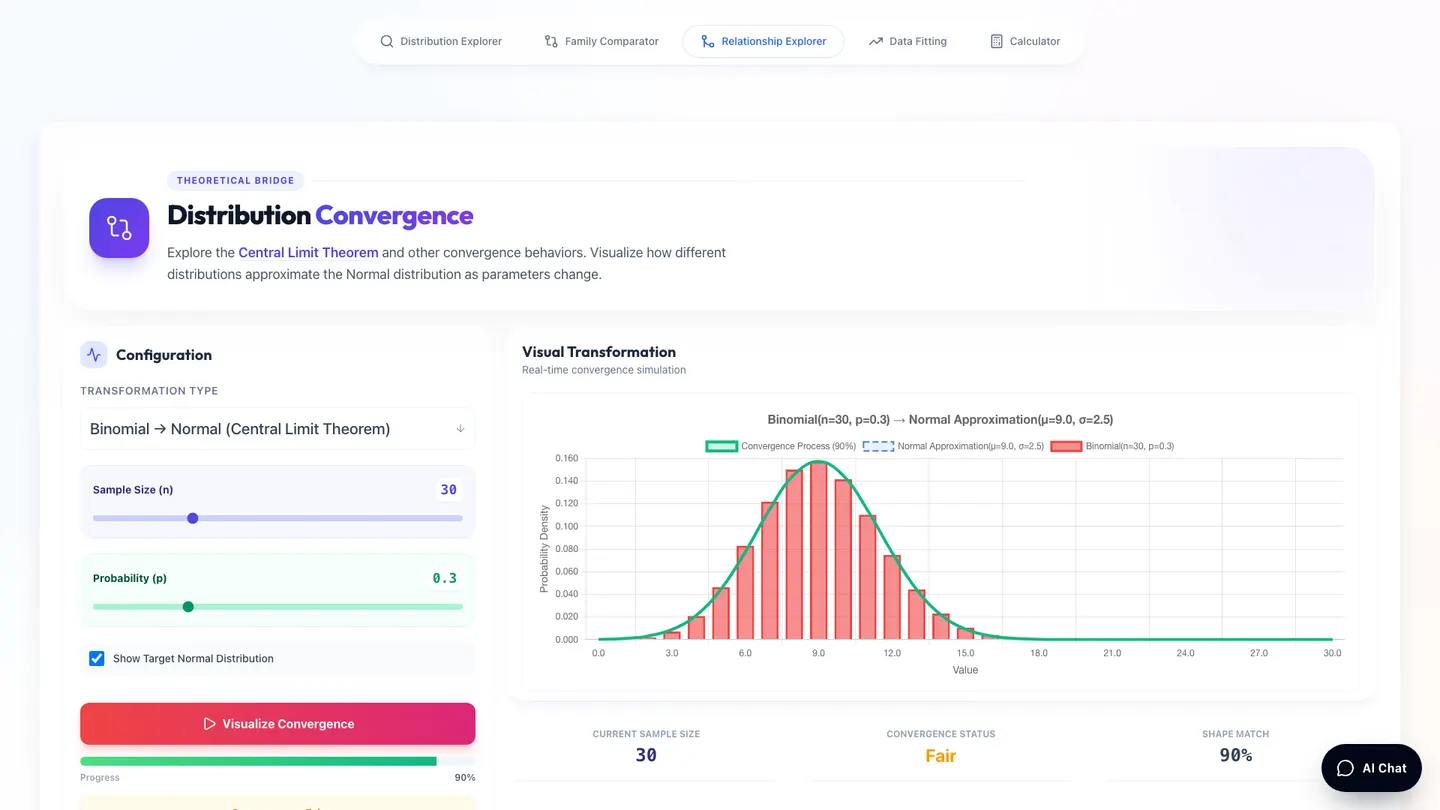
UnderstandLimiting relationships and approximationsRead guide
FitCandidate models and fit diagnostics for sample dataRead guide
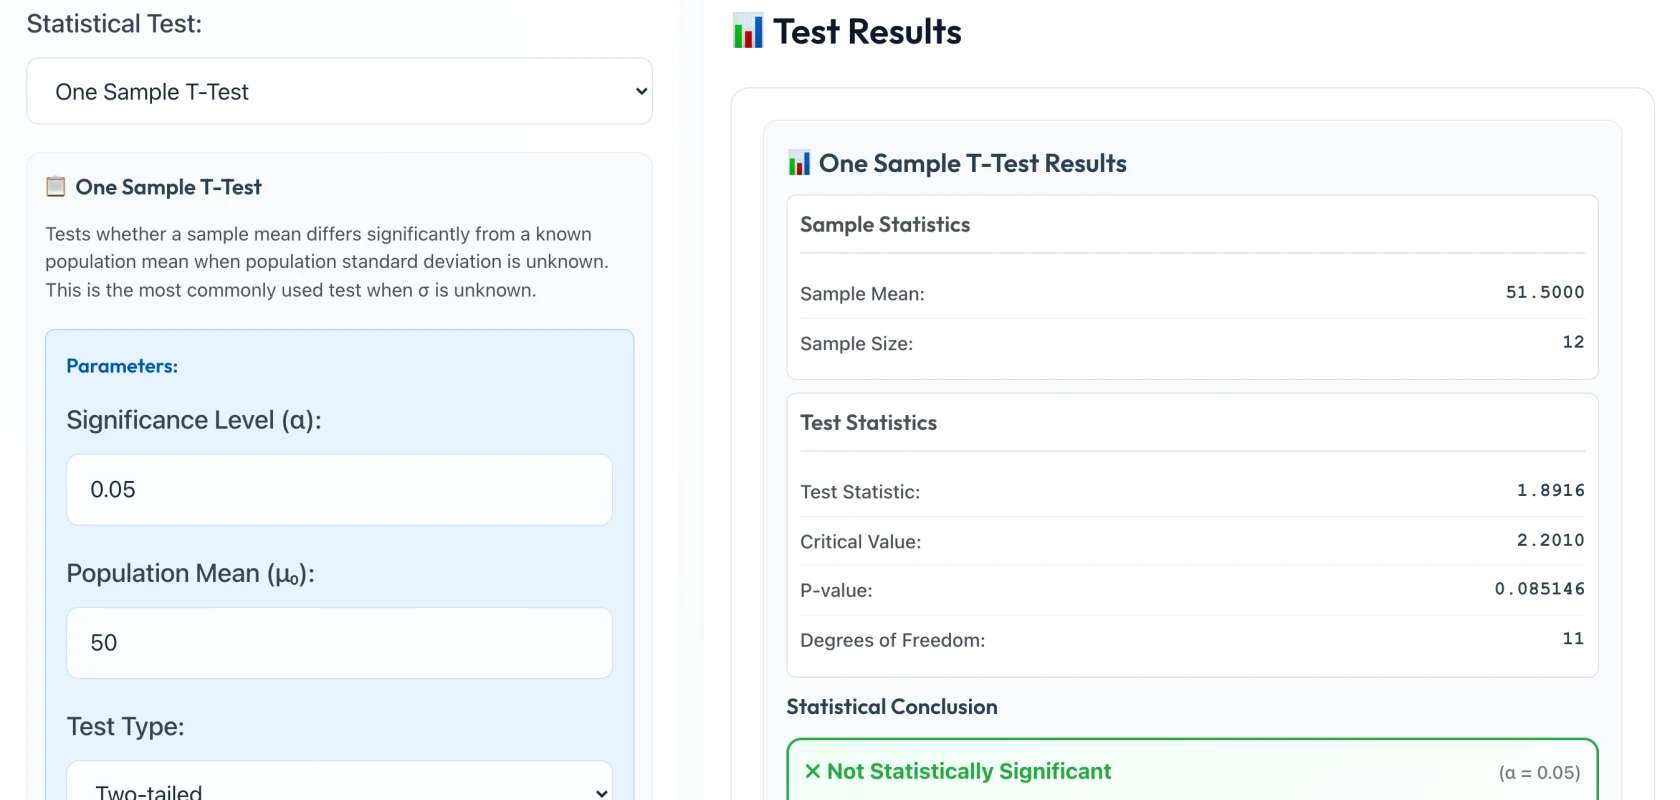
CalculateSupported probabilities and hypothesis testsRead guide

A quick worked example

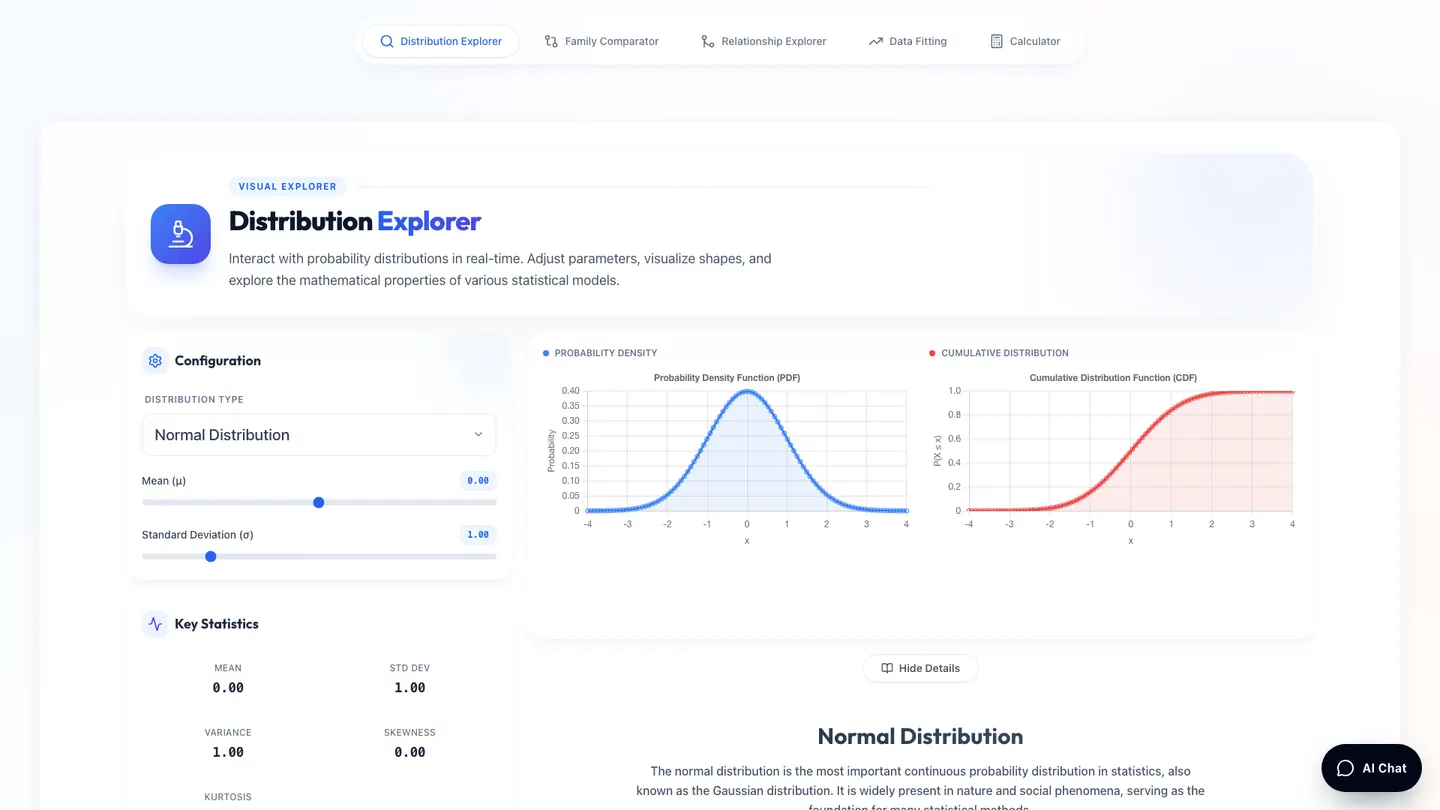
To see how variability changes a normal distribution, open the Distribution Explorer, keep the mean fixed, and increase the standard deviation. The curve becomes wider and lower while total area remains one. A fixed interval around the mean then contains less probability.

The average did not move; uncertainty around it increased. That separation between location and spread is easier to understand when the formula, parameters, probability, and chart update together.

Follow the full guide

Built for responsible interpretation

DistriScope does not treat a p-value as the probability that a hypothesis is true, visual similarity as proof of fit, or a precise output as proof that the selected method is appropriate. Tool pages document assumptions, limitations, and reproducible workflows.

The project uses established numerical libraries and publishes its source code for inspection. Explanatory content is reviewed with a visible date, and reproducible correction reports are welcome through GitHub.

Review how DistriScope works →

Elevate Your Analysis

Move from a statistical question to an interactive graph, calculation, and assumption-aware interpretation in one workspace.